Rolling Log Returns [BackQuant]Rolling Log Returns
The Rolling Log Returns indicator is a versatile tool designed to help traders, quants, and data-driven analysts evaluate the dynamics of price changes using logarithmic return analysis. Widely adopted in quantitative finance, log returns offer several mathematical and statistical advantages over simple returns, making them ideal for backtesting, portfolio optimization, volatility modeling, and risk management.
What Are Log Returns?
In quantitative finance, logarithmic returns are defined as:
ln(Pₜ / Pₜ₋₁)
or for rolling periods:
ln(Pₜ / Pₜ₋ₙ)
where P represents price and n is the rolling lookback window.
Log returns are preferred because:
They are time additive : returns over multiple periods can be summed.
They allow for easier statistical modeling , especially when assuming normally distributed returns.
They behave symmetrically for gains and losses, unlike arithmetic returns.
They normalize percentage changes, making cross-asset or cross-timeframe comparisons more consistent.
Indicator Overview
The Rolling Log Returns indicator computes log returns either on a standard (1-period) basis or using a rolling lookback period , allowing users to adapt it to short-term trading or long-term trend analysis.
It also supports a comparison series , enabling traders to compare the return structure of the main charted asset to another instrument (e.g., SPY, BTC, etc.).
Core Features
✅ Return Modes :
Normal Log Returns : Measures ln(price / price ), ideal for day-to-day return analysis.
Rolling Log Returns : Measures ln(price / price ), highlighting price drift over longer horizons.
✅ Comparison Support :
Compare log returns of the primary instrument to another symbol (like an index or ETF).
Useful for relative performance and market regime analysis .
✅ Moving Averages of Returns :
Smooth noisy return series with customizable MA types: SMA, EMA, WMA, RMA, and Linear Regression.
Applicable to both primary and comparison series.
✅ Conditional Coloring :
Returns > 0 are colored green ; returns < 0 are red .
Comparison series gets its own unique color scheme.
✅ Extreme Return Detection :
Highlight unusually large price moves using upper/lower thresholds.
Visually flags abnormal volatility events such as earnings surprises or macroeconomic shocks.
Quantitative Use Cases
🔍 Return Distribution Analysis :
Gain insight into the statistical properties of asset returns (e.g., skewness, kurtosis, tail behavior).
📉 Risk Management :
Use historical return outliers to define drawdown expectations, stress tests, or VaR simulations.
🔁 Strategy Backtesting :
Apply rolling log returns to momentum or mean-reversion models where compounding and consistent scaling matter.
📊 Market Regime Detection :
Identify periods of consistent overperformance/underperformance relative to a benchmark asset.
📈 Signal Engineering :
Incorporate return deltas, moving average crossover of returns, or threshold-based triggers into machine learning pipelines or rule-based systems.
Recommended Settings
Use Normal mode for high-frequency trading signals.
Use Rolling mode for swing or trend-following strategies.
Compare vs. a broad market index (e.g., SPY or QQQ ) to extract relative strength insights.
Set upper and lower thresholds around ±5% for spotting major volatility days.
Conclusion
The Rolling Log Returns indicator transforms raw price action into a statistically sound return series—equipping traders with a professional-grade lens into market behavior. Whether you're conducting exploratory data analysis, building factor models, or visually scanning for outliers, this indicator integrates seamlessly into a modern quant's toolbox.
在脚本中搜索"moving average crossover"

JJ Highlight Time Ranges with First 5 Minutes and LabelsTo effectively use this Pine Script as a day trader , here’s how the various elements can help you manage trades, track time sessions, and monitor price movements:
Key Components for a Day Trader:
1. First 5-Minute Highlight:
- Purpose: Day traders often rely on the first 5 minutes of the trading session to gauge market sentiment, watch for opening price gaps, or plan entries. This script draws a horizontal line at the high or low of the first 5 minutes, which can act as a key level for the rest of the day.
- How to Use: If the price breaks above or below the first 5-minute line, it can signal momentum. You might enter a long position if the price breaks above the first 5-minute high or a short if it breaks below the first 5-minute low.
2. Session Time Highlights:
- Morning Session (9:15–10:30 AM): The market often shows its strongest price action during the first hour of trading. This session is highlighted in yellow. You can use this highlight to focus on the most volatile period, as this is when large institutional moves tend to occur.
- Afternoon Session (12:30–2:55 PM): The blue highlight helps you track the mid-afternoon session, where liquidity may decrease, and price action can sometimes be choppier. Day traders should be more cautious during this period.
- How to Use: By highlighting these key times, you can:
- Focus on key breakouts during the morning session.
- Be more conservative in your trades during the afternoon, as market volatility may drop.
3. Dynamic Labels:
- Top/Bottom Positioning: The script places labels dynamically based on the selected position (Top or Bottom). This allows you to quickly glance at the session's start and identify where you are in terms of time.
- How to Use: Use these labels to remind yourself when major time segments (morning or afternoon) begin. You can adjust your trading strategy depending on the session, e.g., being more aggressive in the morning and more cautious in the afternoon.
Trading Strategy Suggestions:
1. Momentum Trades:
- After the first 5 minutes, use the high/low of that period to set up breakout trades.
- Long Entry: If the price breaks the high of the first 5 minutes (especially if there's a strong trend).
- Short Entry: If the price breaks the low of the first 5 minutes, signaling a potential downtrend.
2. Session-Based Strategy:
- Morning Session (9:15–10:30 AM):
- Look for strong breakout patterns such as support/resistance levels, moving average crossovers, or candlestick patterns (like engulfing candles or pin bars).
- This is a high liquidity period, making it ideal for executing quick trades.
- Afternoon Session (12:30–2:55 PM):
- The market tends to consolidate or show less volatility. Scalping and mean-reversion strategies work better here.
- Avoid chasing big moves unless you see a clear breakout in either direction.
3. Support and Resistance:
- The first 5-minute high/low often acts as a key support or resistance level for the rest of the day. If the price holds above or below this level, it’s an indication of trend continuation.
4. Breakout Confirmation:
- Look for breakouts from the highlighted session time ranges (e.g., 9:15 AM–10:30 AM or 12:30 PM–2:55 PM).
- If a breakout happens during a key time window, combine that with other technical indicators like volume spikes , RSI , or MACD for confirmation.
---
Example Day Trader Usage:
1. First 5 Minutes Strategy: After the market opens at 9:15 AM, watch the price action for the first 5 minutes. The high and low of these 5 minutes are critical levels. If the price breaks above the high of the first 5 minutes, it might indicate a strong bullish trend for the day. Conversely, breaking below the low may suggest bearish movement.
2. Morning Session: After the first 5 minutes, focus on the **9:15 AM–10:30 AM** window. During this time, look for breakout setups at key support/resistance levels, especially when paired with high volume or momentum indicators. This is when many institutions make large trades, so price action tends to be more volatile and predictable.
3. Afternoon Session: From 12:30 PM–2:55 PM, the market might experience lower volatility, making it ideal for scalping or range-bound strategies. You could look for reversals or fading strategies if the market becomes too quiet.
Conclusion:
As a day trader, you can use this script to:
- Track and react to key price levels during the first 5 minutes.
- Focus on high volatility in the morning session (9:15–10:30 AM) and **be cautious** during the afternoon.
- Use session-based timing to adjust your strategies based on the time of day.

Volume Brakeout v1Volume Brakout indicator is used to help determine trend direction strictly based on Negative and Positive volume data.
How to Read:
- Moving Average crossovers are used to help determine a possible trend change or retracement.
- The area cloud on the bottom is calculated by the difference of the moving averages. This could be used to help determine the trending volume strength.
- Bright colored volume bars are large volume spikes calculated by the x factor in the options.
Other changes:
- Volume Depth is going open source with numerous of its indicators. This is only one of many!
- Volume is now displayed without being altered for calculations.

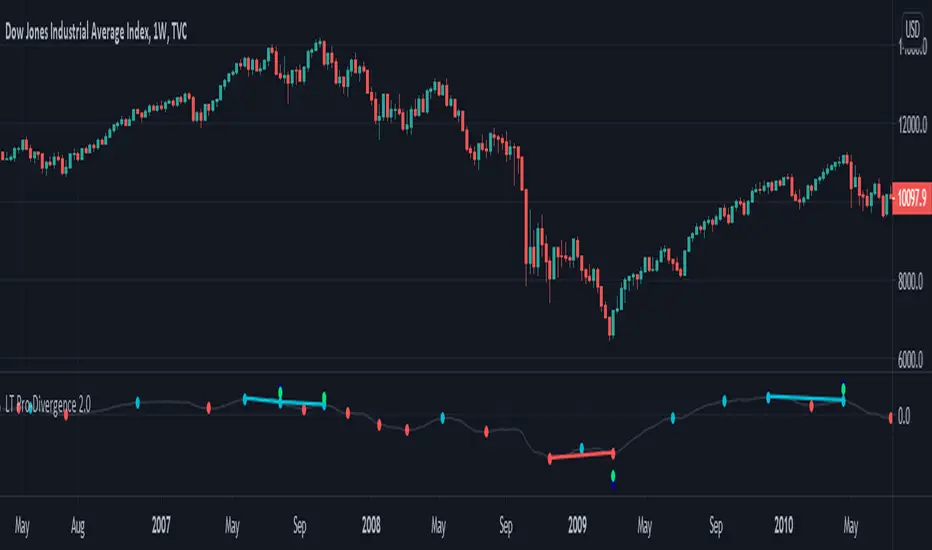
LT Pro-Divergence 2.0This indicator can visually show the divergences on the chart – i.e. a divergence between price action and the momentum. So for example, when price makes a new low and the momentum does not make a new low, this is often a “bullish” divergence – indicating that the force of the downtrend could be weakening. Similarly, when the price makes a new high but the momentum does not make a new high, this is often a “bearish” divergence – indicating that the force of the uptrend could be weakening. Typically, trend reversals are often preceded by a divergence (although it is possible for price to change trend without a prior divergence). We can use divergence as an advance warning of when price may potentially change direction – whether a change in the trend direction or just a correction (or pullback).
It is possible for a divergence to be “negated” – which happens when price continues to move in its direction (i.e. in the direction of the major trend) despite a divergence. So often price can negate a divergence (e.g. a bullish or bearish divergence). This can happen quite a lot in strong trends with momentum.
Due to the numerous divergences that can occur on charts (often with many false signals or whipsaws) – it can be better to use divergence in combination with other technical analysis methods to increase the probabilities. For example, combining divergence with other trend reversal chart techniques such as: trendline breaks, moving average crossovers, break of support or resistance, or oscillators like MACD or RSI etc.
The red divergence colour can indicate a potential bullish divergence, blue divergence colour can indicate a potential bearish divergence. The indicator can also warn of potential divergences developing – so a magenta warning can indicate a potential bullish divergence and a yellow/orange warning of a potential bearish divergence.
The pro divergence indicator incorporates green and blue dots to show when RSI and stochastics is oversold or overbought. The RSI overbought/oversold is shown as dark blue dots – and the stochastics overbought/oversold is shown as green dots. This is added as an extra feature to add further information to the divergence signal. The momentum used in the indicator is the MACD.
The indicator can be used on the charts of the majority of markets (e.g. stocks, indices, ETFs, currencies, cryptocurrencies, precious metals, commodities etc.) and any timeframe. It should be noted that the degree of noise and randomness increases significantly on lower timeframes. So the lower the timeframe that is chosen (e.g. 15-min or lower) the greater the degree of noise and randomness and therefore the higher the frequency of false signals or whipsaws.
Chartists should be aware of the probabilistic and uncertain nature of price action and the markets, and therefore prepare to limit and control any potential risks.
If you would like access, please send me a PM on Tradingview.
LT Pro-Divergence 2.0 ChartThis indicator can visually show the divergences on the chart – i.e. a divergence between price action and the momentum. So for example, when price makes a new low and the momentum does not make a new low, this is often a “bullish” divergence – indicating that the force of the downtrend could be weakening. Similarly, when the price makes a new high but the momentum does not make a new high, this is often a “bearish” divergence – indicating that the force of the uptrend could be weakening. Typically, trend reversals are often preceded by a divergence (although it is possible for price to change trend without a prior divergence). We can use divergence as an advance warning of when price may potentially change direction – whether a change in the trend direction or just a correction (or pullback).
It is possible for a divergence to be “negated” – which happens when price continues to move in its direction (i.e. in the direction of the major trend) despite a divergence. So often price can negate a divergence (e.g. a bullish or bearish divergence). This can happen quite a lot in strong trends with momentum.
Due to the numerous divergences that can occur on charts (often with many false signals or whipsaws) – it can be better to use divergence in combination with other technical analysis methods to increase the probabilities. For example, combining divergence with other trend reversal chart techniques such as: trendline breaks, moving average crossovers, break of support or resistance, or oscillators like MACD or RSI etc.
The red divergence colour can indicate a potential bullish divergence, blue divergence colour can indicate a potential bearish divergence. The indicator can also warn of potential divergences developing – so a magenta warning can indicate a potential bullish divergence and a yellow/orange warning of a potential bearish divergence.
The pro divergence indicator incorporates green and blue dots to show when RSI and stochastics is oversold or overbought. The RSI overbought/oversold is shown as dark blue dots – and the stochastics overbought/oversold is shown as green dots. This is added as an extra feature to add further information to the divergence signal. The momentum used in the indicator is the MACD.
The indicator can be used on the charts of the majority of markets (e.g. stocks, indices, ETFs, currencies, cryptocurrencies, precious metals, commodities etc.) and any timeframe. It should be noted that the degree of noise and randomness increases significantly on lower timeframes. So the lower the timeframe that is chosen (e.g. 15-min or lower) the greater the degree of noise and randomness and therefore the higher the frequency of false signals or whipsaws.
Chartists should be aware of the probabilistic and uncertain nature of price action and the markets, and therefore prepare to limit and control any potential risks.
If you would like access, please send me a PM on Tradingview.

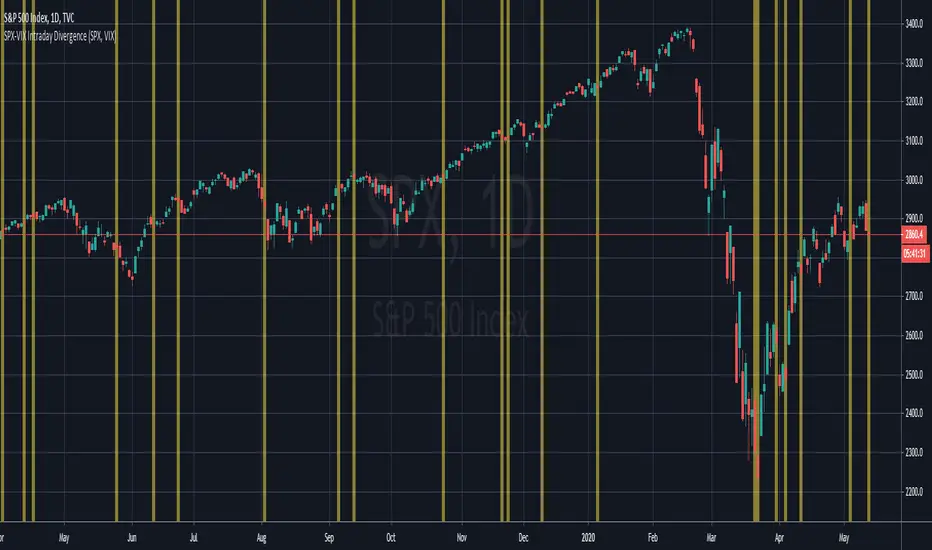
SPX-VIX Intraday DivergenceAs a long-term buyer/short-seller, you will always find different ways to enter the market , moving average crossovers, breakouts , overbought/oversold conditions being some of the classy methods. However, they are decreasingly effective... 😢
Recently I have realized that analysis beyond the technical indicators will bring trading to the next level because I will be able to confirm my trading signals without relying too much on basic price actions and patterns which are easily manipulated by big banks and institutions. 👍
Today I will introduce you to my divergence indicator making use of SPX and VIX. Unlike MacD or RSI divegence , which would involve normative judgement , it will take account of the unusual move by SPX alongwith the VIX , to the exploit chances that options market, where most experienced investors participated in has a preceding insight into the equity market about the upcoming moves.
I have divided signals into two groups.
Bullish divergence - SPX Down , VIX also Down 👇
Bearish divergence - SPX Up , VIX also Up 👆
I hope this script will enable us to take advantage of the options market activities , to provide a REAL divergence signal, and be used coupled with our own chart patterns or other price signals, and more importantly to score more and more winning trades!!!
If you want more useful scripts from me, please like and share my posts. And don't forget to follow my account to grab the latest ideas and tools! 😘
Gekko DEMA StrategyThis script is based upon the Gekko trading strategy.
This strategy uses Exponential Moving Average crossovers to determine the current trend the market is in. Using this information it will suggest to ride the trend. Note that this is not MACD because it just checks whether the longEMA and shortEMA are % removed from each other.
* short is the short EMA that moves closer to the real market (including noise)
* long is the long EMA that lags behind the market more but is also more resistant to noise.
* the down threshold and the up threshold tell Gekko how big the difference in the lines needs to be for it to be considered a trend. If you set these to 0 each line cross would trigger new advice.
The base strategy has had money management logic added and has been tested for best results. Once you have access, you can modify these settings to find what works best for you.
Access to this strategy is FREE! Message me for more information on how to get access.

unRekt - The MachineThis is a combined script of Welcome to the Machine and Kiss Cross. A moving average crossover was added with the golden cross '50 n 200' being most noticeable.
Up to 5 editable moving averages can be selected on their own or all displayed with varying type of your choice SMA, EMA, WMA, VWMA and LSMA.
Bollinger bands can be disabled to just show the moving average.
Image of bollinger bands off:

Volume Flow v3DepthHouse Volume Flow indicator is used to help determine trend direction strictly based on Negative and Positive volume data.
How to Read:
- Moving Average crossovers are used to help determine a possible trend change or retracement.
- The area cloud on the bottom is calculated by the difference of the moving averages. This could be used to help determine the trending volume strength.
- Bright colored volume bars are large volume spikes calculated by the x factor in the options.
Other changes:
- DepthHouse is going open source with numerous of its indicators. This is only one of many!
- Volume is now displayed without being altered for calculations.

NEURAL FLOW | The AI-Powered Regime Classifier [by @Ash_TheTrade📉 Stop Trading Blindly. Filter the Noise with AI.
Why do your favorite strategies work perfectly one week and bleed your account the next?
The answer is simple: Context.
A Moving Average crossover works in a trend but gets slaughtered in chop. RSI works in a range but fails in a strong breakout. Most indicators are "dumb"—they apply the same math regardless of the market's current reality.
I created Neural Flow to fix this.
Developed by @Ash_TheTrader, this isn't just another buy/sell arrow indicator. It is a sophisticated market Regime Classifier built on concepts derived from machine learning (Lorentzian Distance algorithms).
It doesn't just tell you where price is; it tells you what the market is doing.
🧠 The Concept: How It Works
The core idea behind this script is simple yet powerful: Don't trade unless the environment is right.
The Neural Flow algorithm acts like a veteran trader watching over your shoulder. It analyzes multiple "neurons" (data points representing momentum, volatility, and cyclicality) and compares the current price action to historical data.
By identifying what "state" the market is currently in, it paints your chart in real-time, acting as the ultimate filter for any strategy you use.
👁️ The 4 Market Regimes
The indicator instantly classifies the market into one of four distinct states, visualizing them with a full-chart background glow and candle painting:
1. 🐂 Bull Trend (Neon Green)
The market has clear upward momentum, healthy RSI, and strong trend orientation.
Action: Look for Long entries. Buy dips.
2. 🐻 Bear Trend (Neon Red)
The market has clear downward momentum and weak underlying metrics.
Action: Look for Short entries. Sell rallies.
3. 🚫 CHOP (Grey/Monochrome)
This is the most important feature. The AI has detected low volatility squeeze conditions or directionless ADX. This is where 80% of traders lose money due to fake-outs and whipsaws.
Action: DO NOT TRADE. Sit on your hands and preserve capital.
4. ⚡ Breakout Detected (Gold/Yellow)
The algorithm has detected a sudden, violent expansion in volatility (Bollinger Width explosion) following a period of chop. The direction is not yet confirmed, but a big move is imminent.
Action: Get ready. Watch for a transition into a Bull or Bear regime.
💻 The Glassmorphism Dashboard & AI Confidence
In the corner of your chart, you will find a futuristic, transparent "Glass UI" dashboard designed by @Ash_TheTrader.
It provides instant situational awareness without cluttering your view.
The AI Confidence Score:
This is your conviction meter. It calculates how aligned the various "neurons" of the algorithm are (ranging from 0% to 100%).
A Bull Trend with 40% Confidence might be weak and prone to reversal.
A Bull Trend with 85%+ Confidence indicates strong confluence across multiple data points.
Pro Tip from @Ash_TheTrader: Only take trades when the AI Confidence is above 75%.
🚀 How to Use This in Your Trading
This tool is designed to be versatile.
As a Strategy Filter (Recommended): Use your existing favorite strategy (e.g., MACD, SMC, Price Action). Before taking a trade, glance at the Neural Flow background.
Your strategy says Buy, but the background is Grey (Chop)? Skip the trade.
Your strategy says Sell, and the background is Red (Bear)? Take the trade with confidence.
As a Standalone System: Wait for the market to transition out of "Grey Chop" into a "Green Bull" or "Red Bear" regime. Confirm that the "AI Confidence" on the dashboard is high (>70%), and enter in the direction of the new trend.
⚙️ Settings & Customization
While the default settings are tuned for most markets, @Ash_TheTrader believes in flexibility:
Training Window: Adjust the sensitivity of the regime detection.
Visuals: Customize all colors to match your chart aesthetic.
Glass Dashboard: Move it, resize it, or turn it off completely.
Baseline EMA: Toggle the 50-period baseline reference line on or off to keep your charts ultra-clean.
A Note from the Author:
"Trading isn't about catching every move; it's about catching the right moves and staying safe during the noise. I built this tool to help me instantly recognize when to step on the gas and when to hit the brakes. I hope it brings clarity to your charts."
— @Ash_TheTrader
Disclaimer: This tool is for informational purposes only and does not constitute financial advice. Always manage your risk.

Dual MA Crossover with Profit Targets + Stop-LossChatGPT script and is a dual moving average crossover script with profit targets and stop loss

TPFX - Unified Strategy v8.1 (COT + Valuation + S/D + Seasonal)
TPFX - Unified Strategy v8.1: A 5-in-1 Confluence Model
The TPFX Unified Strategy is a comprehensive trading model that integrates five distinct market analysis modules into a single indicator. Its primary function is to generate high-confluence entry and exit signals by requiring validation across multiple layers of market analysis. This approach aims to minimize noise and focus trading activity on moments of strong directional agreement.
Core Analytical Modules:
1. COT Index (Commitment of Traders): Quantifies the relative extreme positioning of major market participants (Commercials, Large Speculators) over a user-defined lookback period to identify overextended sentiment.
2. COT Momentum: Utilizes Commercial net positioning to detect momentum shifts, based on either a new high/low logic or a Moving Average crossover.
3. Valuation Trigger: Compares the relative performance of the current symbol against a reference asset (e.g., DXY) to determine periods of comparative overvaluation or undervaluation.
4. Supply and Demand (S/D) Zones: Automatically identifies and plots institutional S/D zones based on specific candle patterns. These zones provide precise entry, stop-loss, and dynamic take-profit targets upon activation and retest.
5. Seasonal Filter: Applies a calendar-based constraint to limit trade entry to historically favorable or unfavorable periods for the specific asset.
Key Strategy Features:
* Modular Control: All five modules can be independently enabled or disabled via input settings, allowing the user to customize the required confluence level for signal generation.
* Flexible Exit Management: The strategy supports four primary exit methodologies:
* Fixed TP/SL: Standard point or percentage-based risk management.
* Dynamic (S/D Zones): Uses the S/D zone boundaries for stop-loss and either a fixed R:R ratio or the nearest opposite zone for take-profit.
* Opposite Signal: Closes a position when a full, confirmed signal in the opposite direction is generated.
* Mean Reversion: Closes the position when the COT Index or Valuation Line reverts to a defined mean level.
* Risk Parameters: Includes configurable order size, trade direction filtering (Long, Short, Both), and adjustable parameters for S/D zone detection logic.
v8.1 Update: This version features a syntax correction within the Supply/Demand Zones calculation block to ensure reliable zone detection and trigger logic.
This tool is designed for systematic traders seeking to align their decisions with fundamental flows and order book imbalances.
(Note: Full functionality relies on access to the Commitment of Traders data feed, which may require a subscription.)

Nick2k Trend Tracker MT botNick2k Trend Tracker MT bot
Type: Indicator (signals + PineConnector alerts for EAs)
Markets: Designed for XAUUSD (gold), adaptable to other symbols
Timeframes: Optimized for M5/M15
---
What it does
Nick2k Trend Tracker MT bot identifies trend flips using a percentile-normalized SMA slope with hysteresis, then applies a multi-layer filter suite to avoid false signals in low-quality conditions.
It can optionally auto-manage trades via PineConnector:
Send open orders with SL/TP (ATR- or pip-based)
Breakeven activation
Dual trailing stops (pip-based or ATR-based)
Staged partial closes (up to 3 levels)
The indicator also:
Highlights chop zones in the background
Provides diagnostic labels showing which filters passed/failed
Lets you disable all alerts with one checkbox (visual testing mode)
---
Core logic (simplified)
Trend Engine: SMA slope normalized by a rolling percentile; flips with hysteresis at +0.1/–0.1.
Filters: optional checks for slope strength, ADX, narrow range ratio, ATR squeeze, higher-timeframe slope.
Sessions: entry/management can be gated to London, NY, Tokyo, Sydney sessions and weekdays.
Chop highlight: background shading when ranges/low-volatility are detected for consecutive bars.
---
Visuals
Colored SMA line (gradient by slope)
BUY/SELL labels at valid flip bars
Chop background (yellow overlay)
Filter score/diagnostic label (optional)
---
Alerts & PineConnector integration
Open orders: sent at valid BUY/SELL flips with embedded SL/TP + BE/trailing if enabled
Partial closes: 3 configurable milestones (ATR or pip based, % or fixed lots)
Master toggle: switch all alerts ON/OFF instantly
Alerts are formatted in PineConnector EA syntax for compatibility with MetaTrader auto-trading.
---
Inputs (organized by group)
SMA & Theme (length, colors)
Auto Trading (license, symbol, lots, master toggle)
SL/TP Target Type (prices vs pips)
ATR SL/TP (length, multipliers, rounding)
Breakeven (trigger/offset)
Pip Trailing (trigger/dist/step)
ATR Trailing (TF, period, multiplier, trigger)
Partial Closes (mode, lots or %)
Time Filters (sessions, weekdays)
Filters (Slope, ADX, NRR, ATR squeeze, HTF confirm)
Chop Zone Highlight (on/off, hold bars, color)
---
Why this script is unique (and closed-source)
This is not a simple moving-average crossover. It combines several custom-built methods that are rarely seen in public scripts:
Normalized SMA slope with hysteresis: avoids whipsaws, adapts to volatility regimes.
Multi-filter confirmation: ADX, NRR, ATR squeeze, HTF slope — stacked to improve quality.
Chop detection with persistence: custom counter/hold logic to highlight ranging markets.
Integrated trade management: PineConnector-ready messages with SL/TP, breakeven, dual trailing stops, staged partial closes.
EA-compatible syntax: formatted exactly for PineConnector EAs, including safety toggles.
This represents a full trading framework designed for semi-automated gold scalping, not just a “signal indicator.”
The source is protected to prevent clones and preserve development effort invested in unique logic and PineConnector integration.
---
Recommended starting settings (XAUUSD M5/M15)
Pip size: 0.10
Slope threshold: 0.20 (M5), 0.16–0.20 (M15)
ADX min: 18–22
NRR floor: 2.0–2.4
ATR ratio: 0.65–0.75
ATR SL/TP: SL = 1.5×ATR, TP = 2.5×ATR
Sessions: London & NY
---
Limitations & disclaimer
Not financial advice. Test on demo before live trading.
Performance depends on broker symbols, spread, and volatility regime.
Auto-trading requires PineConnector EA set up correctly.
---
Changelog
v1.0 – Initial release (trend engine, filters, sessions, chop highlight, PineConnector alerts, BE/trailing, partial closes, diagnostics)

Dr. Keith Wade Momentum SignalsThis is a heikin Ashli strategy combined with an 18 moving average crossover. Entry at cross of 18 EMA and exit at change of heikin Ashi

Long/Short/Exit/Risk management Strategy # LongShortExit Strategy Documentation
## Overview
The LongShortExit strategy is a versatile trading system for TradingView that provides complete control over entry, exit, and risk management parameters. It features a sophisticated framework for managing long and short positions with customizable profit targets, stop-loss mechanisms, partial profit-taking, and trailing stops. The strategy can be enhanced with continuous position signals for visual feedback on the current trading state.
## Key Features
### General Settings
- **Trading Direction**: Choose to trade long positions only, short positions only, or both.
- **Max Trades Per Day**: Limit the number of trades per day to prevent overtrading.
- **Bars Between Trades**: Enforce a minimum number of bars between consecutive trades.
### Session Management
- **Session Control**: Restrict trading to specific times of the day.
- **Time Zone**: Specify the time zone for session calculations.
- **Expiration**: Optionally set a date when the strategy should stop executing.
### Contract Settings
- **Contract Type**: Select from common futures contracts (MNQ, MES, NQ, ES) or custom values.
- **Point Value**: Define the dollar value per point movement.
- **Tick Size**: Set the minimum price movement for accurate calculations.
### Visual Signals
- **Continuous Position Signals**: Implement 0 to 1 visual signals to track position states.
- **Signal Plotting**: Customize color and appearance of position signals.
- **Clear Visual Feedback**: Instantly see when entry conditions are triggered.
### Risk Management
#### Stop Loss and Take Profit
- **Risk Type**: Choose between percentage-based, ATR-based, or points-based risk management.
- **Percentage Mode**: Set SL/TP as a percentage of entry price.
- **ATR Mode**: Set SL/TP as a multiple of the Average True Range.
- **Points Mode**: Set SL/TP as a fixed number of points from entry.
#### Advanced Exit Features
- **Break-Even**: Automatically move stop-loss to break-even after reaching specified profit threshold.
- **Trailing Stop**: Implement a trailing stop-loss that follows price movement at a defined distance.
- **Partial Profit Taking**: Take partial profits at predetermined price levels:
- Set first partial exit point and percentage of position to close
- Set second partial exit point and percentage of position to close
- **Time-Based Exit**: Automatically exit a position after a specified number of bars.
#### Win/Loss Streak Management
- **Streak Cutoff**: Automatically pause trading after a series of consecutive wins or losses.
- **Daily Reset**: Option to reset streak counters at the start of each day.
### Entry Conditions
- **Source and Value**: Define the exact price source and value that triggers entries.
- **Equals Condition**: Entry signals occur when the source exactly matches the specified value.
### Performance Analytics
- **Real-Time Stats**: Track important performance metrics like win rate, P&L, and largest wins/losses.
- **Visual Feedback**: On-chart markers for entries, exits, and important events.
### External Integration
- **Webhook Support**: Compatible with TradingView's webhook alerts for automated trading.
- **Cross-Platform**: Connect to external trading systems and notification platforms.
- **Custom Order Execution**: Implement advanced order flows through external services.
## How to Use
### Setup Instructions
1. Add the script to your TradingView chart.
2. Configure the general settings based on your trading preferences.
3. Set session trading hours if you only want to trade specific times.
4. Select your contract specifications or customize for your instrument.
5. Configure risk parameters:
- Choose your preferred risk management approach
- Set appropriate stop-loss and take-profit levels
- Enable advanced features like break-even, trailing stops, or partial profit taking as needed
6. Define entry conditions:
- Select the price source (such as close, open, high, or an indicator)
- Set the specific value that should trigger entries
### Entry Condition Examples
- **Example 1**: To enter when price closes exactly at a whole number:
- Long Source: close
- Long Value: 4200 (for instance, to enter when price closes exactly at 4200)
- **Example 2**: To enter when an indicator reaches a specific value:
- Long Source: ta.rsi(close, 14)
- Long Value: 30 (triggers when RSI equals exactly 30)
### Best Practices
1. **Always backtest thoroughly** before using in live trading.
2. **Start with conservative risk settings**:
- Small position sizes
- Reasonable stop-loss distances
- Limited trades per day
3. **Monitor and adjust**:
- Use the performance table to track results
- Adjust parameters based on how the strategy performs
4. **Consider market volatility**:
- Use ATR-based stops during volatile periods
- Use fixed points during stable markets
## Continuous Position Signals Implementation
The LongShortExit strategy can be enhanced with continuous position signals to provide visual feedback about the current position state. These signals can help you track when the strategy is in a long or short position.
### Adding Continuous Position Signals
Add the following code to implement continuous position signals (0 to 1):
```pine
// Continuous position signals (0 to 1)
var float longSignal = 0.0
var float shortSignal = 0.0
// Update position signals based on your indicator's conditions
longSignal := longCondition ? 1.0 : 0.0
shortSignal := shortCondition ? 1.0 : 0.0
// Plot continuous signals
plot(longSignal, title="Long Signal", color=#00FF00, linewidth=2, transp=0, style=plot.style_line)
plot(shortSignal, title="Short Signal", color=#FF0000, linewidth=2, transp=0, style=plot.style_line)
```
### Benefits of Continuous Position Signals
- Provides clear visual feedback of current position state (long/short)
- Signal values stay consistent (0 or 1) until condition changes
- Can be used for additional calculations or alert conditions
- Makes it easier to track when entry conditions are triggered
### Using with Custom Indicators
You can adapt the continuous position signals to work with any custom indicator by replacing the condition with your indicator's logic:
```pine
// Example with moving average crossover
longSignal := fastMA > slowMA ? 1.0 : 0.0
shortSignal := fastMA < slowMA ? 1.0 : 0.0
```
## Webhook Integration
The LongShortExit strategy is fully compatible with TradingView's webhook alerts, allowing you to connect your strategy to external trading platforms, brokers, or custom applications for automated trading execution.
### Setting Up Webhooks
1. Create an alert on your chart with the LongShortExit strategy
2. Enable the "Webhook URL" option in the alert dialog
3. Enter your webhook endpoint URL (from your broker or custom trading system)
4. Customize the alert message with relevant information using TradingView variables
### Webhook Message Format Example
```json
{
"strategy": "LongShortExit",
"action": "{{strategy.order.action}}",
"price": "{{strategy.order.price}}",
"quantity": "{{strategy.position_size}}",
"time": "{{time}}",
"ticker": "{{ticker}}",
"position_size": "{{strategy.position_size}}",
"position_value": "{{strategy.position_value}}",
"order_id": "{{strategy.order.id}}",
"order_comment": "{{strategy.order.comment}}"
}
```
### TradingView Alert Condition Examples
For effective webhook automation, set up these alert conditions:
#### Entry Alert
```
{{strategy.position_size}} != {{strategy.position_size}}
```
#### Exit Alert
```
{{strategy.position_size}} < {{strategy.position_size}} or {{strategy.position_size}} > {{strategy.position_size}}
```
#### Partial Take Profit Alert
```
strategy.order.comment contains "Partial TP"
```
### Benefits of Webhook Integration
- **Automated Trading**: Execute trades automatically through supported brokers
- **Cross-Platform**: Connect to custom trading bots and applications
- **Real-Time Notifications**: Receive trade signals on external platforms
- **Data Collection**: Log trade data for further analysis
- **Custom Order Management**: Implement advanced order types not available in TradingView
### Compatible External Applications
- Trading bots and algorithmic trading software
- Custom order execution systems
- Discord, Telegram, or Slack notification systems
- Trade journaling applications
- Risk management platforms
### Implementation Recommendations
- Test webhook delivery using a free service like webhook.site before connecting to your actual trading system
- Include authentication tokens or API keys in your webhook URL or payload when required by your external service
- Consider implementing confirmation mechanisms to verify trade execution
- Log all webhook activities for troubleshooting and performance tracking
## Strategy Customization Tips
### For Scalping
- Set smaller profit targets (1-3 points)
- Use tighter stop-losses
- Enable break-even feature after small profit
- Set higher max trades per day
### For Day Trading
- Use moderate profit targets
- Implement partial profit taking
- Enable trailing stops
- Set reasonable session trading hours
### For Swing Trading
- Use longer-term charts
- Set wider stops (ATR-based often works well)
- Use higher profit targets
- Disable daily streak reset
## Common Troubleshooting
### Low Win Rate
- Consider widening stop-losses
- Verify that entry conditions aren't triggering too frequently
- Check if the equals condition is too restrictive; consider small tolerances
### Missing Obvious Trades
- The equals condition is extremely precise. Price must exactly match the specified value.
- Consider using floating-point precision for more reliable triggers
### Frequent Stop-Outs
- Try ATR-based stops instead of fixed points
- Increase the stop-loss distance
- Enable break-even feature to protect profits
## Important Notes
- The exact equals condition is strict and may result in fewer trade signals compared to other conditions.
- For instruments with decimal prices, exact equality might be rare. Consider the precision of your value.
- Break-even and trailing stop calculations are based on points, not percentage.
- Partial take-profit levels are defined in points distance from entry.
- The continuous position signals (0 to 1) provide valuable visual feedback but don't affect the strategy's trading logic directly.
- When implementing continuous signals, ensure they're aligned with the actual entry conditions used by the strategy.
---
*This strategy is for educational and informational purposes only. Always test thoroughly before using with real funds.*

CANX MA Crossover© CanxStixTrader
Moving average crossover systems measure drift in the market. They are great strategies for time-limited traders. KEEP IT SIMPLE
This strategy works both for buys and sells using the reaction line to guide your position against the reactions.
HOW TO USE THE INDICATOR
1) Choose your market and timeframe.
2) Choose the length.
3) Choose the multiplier.
4) Choose if the strategy is long-only or bidirectional (longs & shorts).
TIPS
The strategy works best in bullish markets as that is the primary direction that market such as stocks, indexes and metals like to move.
- Increase the multiplier to reduce whipsaws
- Increase the length to take fewer trades
- Decrease the length to take more trades
- Try a Long-Only strategy to see if that performs better.
The base set up when you load the indicator is for the 1 minute chart on gold. We found that it also works well on the US Indexes. For other markets you may need to change the length and multiplier to suit the market and back test its results.


Trend Following with Donchian Channels and MACDThis is a trend following system based on the Donchian Channels. Instead of using a simple moving average crossover, this system uses the MACD as the trendfilter:
Long positions:
* Price makes a new 50 day high,
* The MACD-line crosses above or is above the Signal-line.
* Both the MACD and the Signal-lines are above the zero-line.
Short positions:
* Price makes a new 50 day low,
* The MACD-line crosses below or is below the Signal-line.
* Both the MACD and the Signal-lines are below the zero-line.
Stoploss:
The initial and the trailing stoploss are 4 ATRs away from the price.

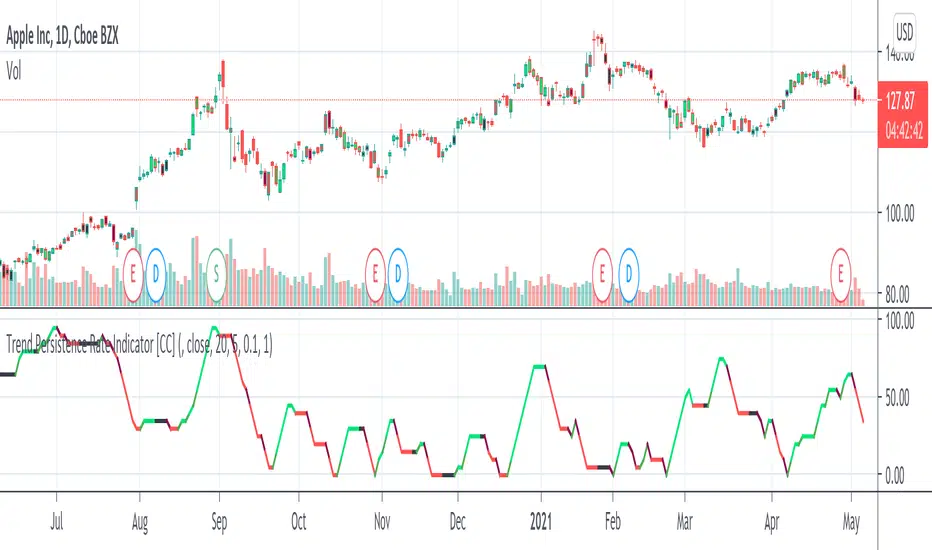
Trend Persistence Rate Indicator [CC]The Trend Persistence Rate Indicator was created by Richard Poster (Stocks and Commodities Feb 2021 pg 12) and this indicator is a good trend strength indicator similar to ADX. A good strategy with this indicator according to the author is to combine this with a moving average crossover strategy and a volatility indicator. Buy when the price crosses over the moving average and when the volatility and this indicator are over a selected minimum. I think 30-40 as a minimum for this indicator works well. Exit that position when this indicator peaks and starts to go down and it should be very profitable for you. I have included general buy and sell signals with this indicator as well.
Let me know if there are any other indicators you would like to see me publish!
Altcoin correlation MeterDear TV'ers,
Hereby a script where the relative strength of an (in this case) altcoin is measured. The script produces a correlation between the altcoin and total altcoin market (Total2 index, see script). Using this script you can see when there is a strong correlation between the two and when there isn't. Moreover, it also produces long/short signals using hull moving average crossover.
Long signals are produced when correlation is below 0 and the hma of the pair is higher than the lagging hma.
Short signals are produced when correlation is below 0 and the hma of the pair is lower than the lagging hma.
Short/Long is closed after correlation is going back towards a set correlation target as well as the Take profit percentage is reached.
In the above example the script is applied to one of my favorite altcoin projects (rose).
Looking forward to feedback/suggestions.

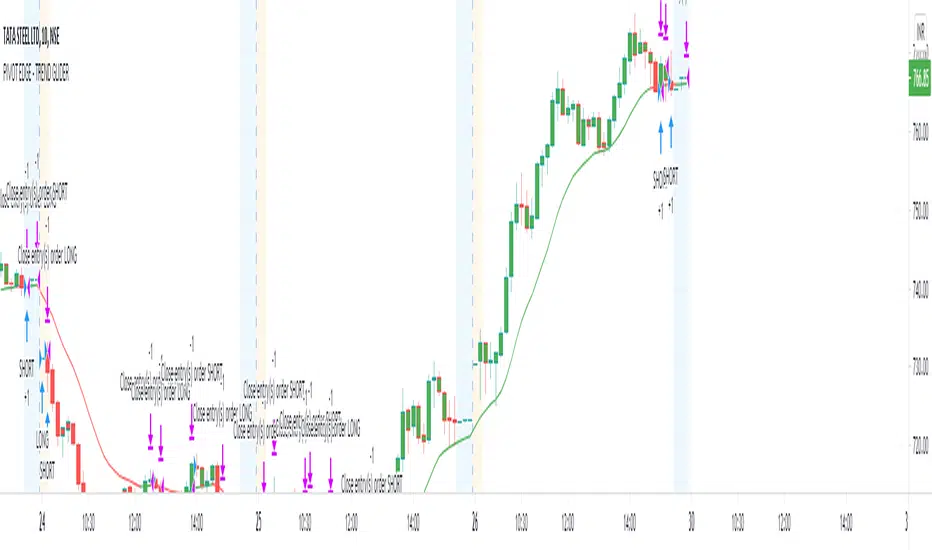
PIVOT EDGE - TREND GLIDEROne of the Biggest challenge in trading is to find the right trend and once we are in the right trend, holding on to winning trades is the next challenge. So this indicator addresses both these issues and helps you with
finding the right trend and also guide you and glide the trades till there is a change in trend by means of proper trend based candle color.
You can just look at the basic candle color as per the prevailing trend and be in the trend as long as the candle colors doesn't change. You need not worry or panic about the small pullbacks or retracements which is a normal
course of any trend continuation. Without this Indicator, in normal situation we would have ended our trades thinking the trend has changed and only to find that trend is again continuing and giving us more than 3-4 times reward after exit.
This Indicator is coded in such a way that no matter what may be the standard color of the candle, This Indicator will paint the candles to Green color in an Uptrend and it will paint the candles RED color in downtrend.
You can take entries as soon as you see the trend formation and wait till the trend is changed or the candle color is changed.
This indicator is intended for the use of newbies or Novice traders to give them confidence and also to guide them towards the proper trend so that they are not taking any counter trend trades.
This Indicator is also beneficial for experienced and master traders to keep them in trade and glide until there is a clear change in trend thereby riding their profits for longer time.
This is a Moving average crossover based strategy but slightly different in the computation where in I have used the customized PEMA values to suit most favorable win ratio.
The results are best when used for timeframe of 10 mins and above. Also you must know the basics of candle stick patterns and price action to take suitable entries and exit at favorable risk reward ratio.
Always do not wait for exit signal from the indicator. You can exit whenever you have gained decent profit and you can keep a trailing stop loss and lock in your profit.
This Indicator works on all Markets and all types of timeframes. Kindly do backtesting for atleast 2-3 months data before using it for live market. Also you must find out which stocks you wish to trade and check if this indicator works favorably for your scripts. The results might slightly vary on stocks
with high volatility.
Always look for the curve in trending up direction of trending down direction. Do not trade whenever the curve is flat and not inclined upside or downside.
Always trade with a suitable STOPLOSS in place and trade with less quantity till you find comfort and confidence with this Indicator.
Further updates to follow periodically. Incase you like this script, like it and share it to others too. Also take a look at the other scripts that I have published.
Happy Trading
Mohan
Smoothed Relative Volatility Index W/2 EMAThis script is a reboot of the relative volatility index that adds a smoothing factor to the indicator which eliminates a significant amount of the noise/signal ratio.
The relative volatility index is defined as the following from tradingism.com:
"Relative Volatility Index Definition
The relative volatility index (RVI) was developed by Donald Dorsey, who truly understood that an indicator is not the holy grail of trading. The RVI is identical to the relative strength index , except it measures the standard deviation of high and low prices over a defined range of periods. The RVI can range from 0 to 100 and unlike many indicators that measure price movement, the RVI does an exceptional job of measuring market strength.
Purpose of Relative Volatility Index
The relative volatility index was designed not as a standalone indicator, but as a confirmation for trading signals. The RVI is most widely used in conjunction with moving average crossover signals."
The rules of the RVI are to sell below the 50 line and buy above the 50 line. The 2 EMA's I added act as a "dynamic" 50 line and also provide crossover signals.
The smoothed relative volatility index included, is accompanied by the original relative volatility index as an option with its own EMA's.
The smoothing factor provides divergence signals and/or an added layer of confirmation from other indicators.
On the chart above is the smoothed relative volatility index above the original set to the same time period for comparison.

Buying vs Selling PowerThis is a simple script that can help identify buying and selling pressure over a period of time.
This is a great addition to any strategy to help confirm direction and strength. You can accompany this indicator with something as simple as a moving average crossover or MACD crossover to help with confirmation of the signal as you want to trade in the direction of volume.
